Vertical equilibrium
Compute vertical equilibrium of a three-dimensional force network.
There are no external loads. Only selfweight is taken into account.
Load the form diagram from a json file.
Here we use a json file representing a form diagram that has already been pre-processed.
Initialise the force diagram.
The force diagram is initialised as the dual of the form diagram.
Compute horizontal equilibrium.
This is achieved by parallelising the form and force diagrams. In this example, we keep the geometry of the form diagram fixed (alpha 100). After this, the form and force diagram are not just dual but also reciprocal.
Compute vertical equilibrium.
The equilibrium shape of the force network depends on the distribution of horizontal forces in the form diagram, and on their magnitude in relation to the loads.
Once the distribution of horizontal forces is fixed, the magnitude can be determined by simply choosing a scale factor.
However, it is difficult to predict which scale factor will result in a well-proportioned equilibrium shape.
Instead, the scale factor can be conveniently determined from the desired maximum height of the force network using
vertical_from_zmax.
import compas_tna
from compas_tna.diagrams import FormDiagram
from compas_tna.diagrams import ForceDiagram
from compas_tna.equilibrium import horizontal_nodal
from compas_tna.equilibrium import vertical_from_zmax
from compas_plotters import MeshPlotter
from compas.utilities import i_to_black
FILE = compas_tna.get('tutorial/boundaryconditions.json')
form = FormDiagram.from_json(FILE)
force = ForceDiagram.from_formdiagram(form)
horizontal_nodal(form, force, alpha=100)
scale = vertical_from_zmax(form, 3.0)
# ==============================================================================
# visualise
# ==============================================================================
# draw pipe diagram
# and actual reaction forces
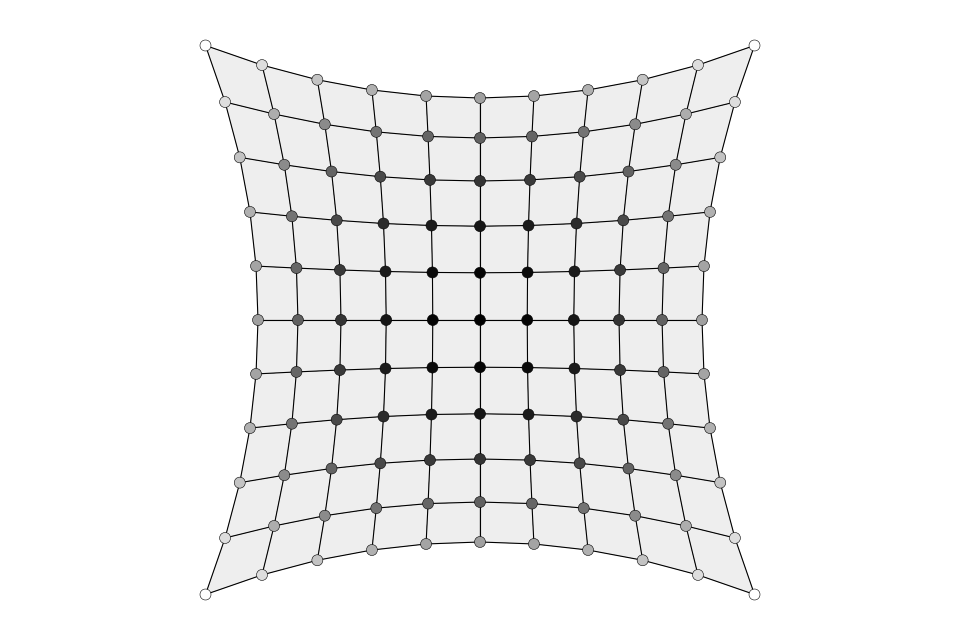
z = form.vertices_attribute('z')
zmin = min(z)
zmax = max(z)
plotter = MeshPlotter(form, figsize=(12, 8), tight=True)
plotter.draw_vertices(
keys=list(form.vertices()),
facecolor={key: i_to_black((attr['z'] - zmin) / (zmax - zmin)) for key, attr in form.vertices(True)},
radius=0.1
)
plotter.draw_edges(
keys=list(form.edges_where({'_is_edge': True}))
)
plotter.draw_faces(keys=list(form.faces_where({'_is_loaded': True})))
plotter.show()